Quantifying the performance of our buildings has never been more important. This is particularly true when we talk about heat networks.
As essential ingredients of our future energy landscape, it is vital that these systems work as they were designed to do.
A year ago, Guru Pinpoint technology was released to visualise the performance of heat networks in real time (See ‘On a mission: using data to optimise heat networks’, CIBSE Journal, April 2016), and it’s changed the way many are designed, specified, commissioned and operated.
We have learned a lot in that year. Unfortunately, we continue to see certificates issued for systems that have not been commissioned correctly.
Good network performance can be the norm if we learn from past mistakes
Using data, we are now able to shine a light on performance from the outset, enabling issues to be rectified before systems are handed over. This is crucial because, on most sites, we typically find one or more systemic issues that will affect long-term performance, and a host of smaller, hidden commissioning- related problems.
How do we know? We have developed a standardised approach to testing performance on all our projects. We inspect every flat and monitor performance under different operating conditions using Guru Pinpoint.
By getting in early and ensuring the contractor rectifies issues before handover, we have seen great results.
A recent scheme has seen volume-weighted average return temperatures drop by 22°C, with volume-weighted average return temperatures from dwellings of 33°C. We reduced losses from return pipework by 75% and saved some £65 per dwelling, per annum.
Thanks to data from sites with issues, we know what can go wrong and where the weak points are. This has enabled us to work with clients to develop standardised design briefs for new developments with heat networks. Specifically, we have developed a design supplement that acts as a bridge between our clients’ requirements and the ADE CIBSE Heat Networks Code of Practice (CP1).

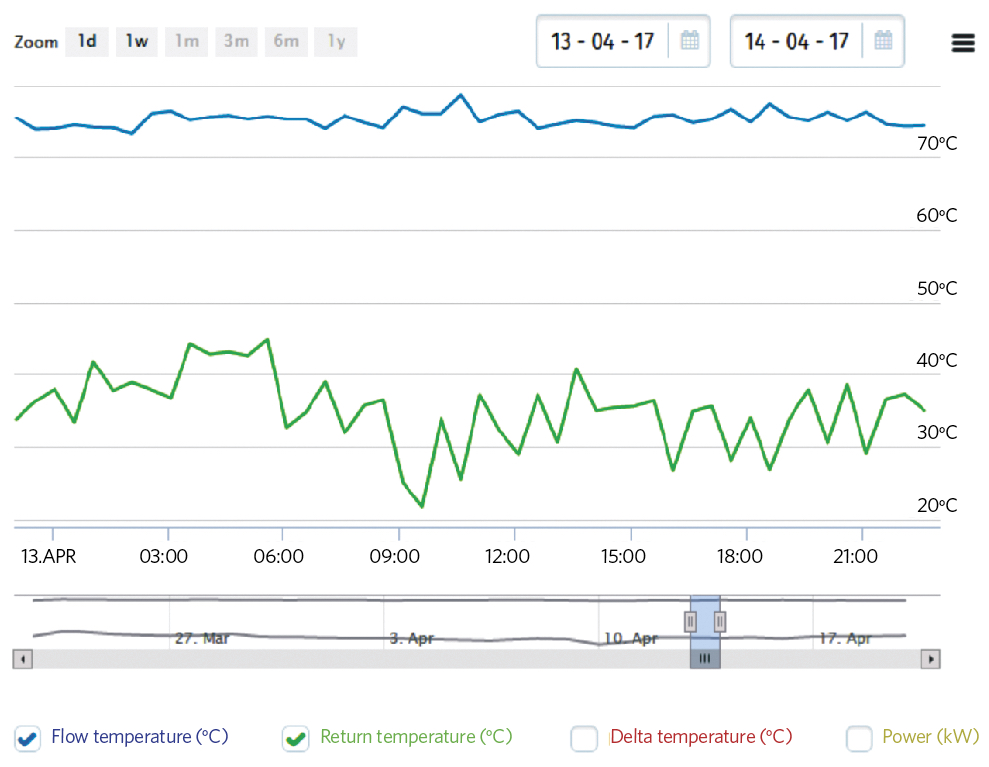
Figure 1: A day’s worth of data from a block level meter on a new-build development, from Guru Pinpoint
Historically, concerns about professional indemnity exposure has led many designers to take an overly cautious ‘more is better’ approach to sizing new heat networks. As a result, they are often grossly oversized.
In most cases, our data shows that peaks are three to four times lower than design. This is having a big effect on the sizing of networks, with a corresponding impact on both capital and ongoing heat costs.
Design consultants have not formerly had the information to enable them to feel comfortable in reducing sizes; this position has now changed. We have found we can strip as much as £2,000 per dwelling from capital expenditure by using data to inform design – despite enhancing specification of the insulation and other items. This results in better, high-performance systems.
We are in the early days of this kind of approach and there is still an education piece to do – and not just with contractors.
Recently, we were presenting the results from a project to a client. A senior technical member of staff was surprised to hear that we were seeing return temperatures in the 30s. We are, in fact, often seeing return temperatures in the 20s, during morning peaks (see Figure 1).
This kind of performance should be the norm –and it can be, if we take a step back and look at how networks are actually performing in practice and learn from past mistakes.
- Gareth Jones is managing director at FairHeat
