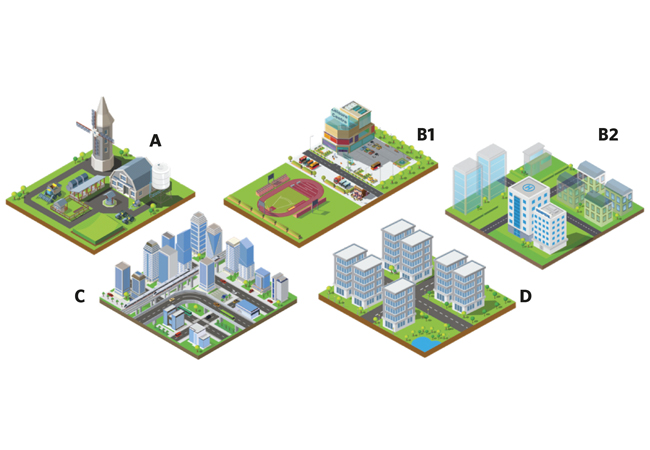
Figure 1: Visual representation of the identified archetypes
The number of heat networks in the UK has risen from 2,000 in 2013 to about 14,000 in 2020, serving nearly 480,000 people. These networks deliver around 12,000GWh of heat each year, making up 3% of the UK’s domestic heat use1. About 990 heat network projects are in the pipeline. By 2050, it’s expected that heat networks will provide heat for 20% of UK homes and 24% of commercial buildings2.
Despite significant potential for expansion, the path forward for heat networks is challenging because of high upfront costs, regulatory complexities, problems securing reliable heat sources and gaining public acceptance2, and – the subject of our study – the inconsistency of current data.
Our research dives into heat network data to spot key trends and patterns and come up with tailored plans for heat networks, to cut carbon.
Multiple databases – such as those of the Department for Energy Security and Net Zero (DESNZ) and the Heat Networks Delivery Unit – often provide incomplete or inconsistent data, making it hard to evaluate accurately how well heat networks are performing.
Ownership diversity, among utility companies, local governments and private entities, adds to the documentation discrepancies. For example, the Department of Energy and Climate Change estimated 4,000 heat networks in London in 2015, including 800 district heating schemes – but data from 2019-22 suggests a significant reduction3. This mismatch highlights the importance of reliable data: without it, strategies may not reflect the current situation, jeopardising decarbonisation efforts. Ensuring data accuracy is crucial for tailoring strategies to actual conditions.
These challenges underscore the need to develop market archetypes and conduct thorough market analyses. By systematically organising and categorising heat networks, this study aims to enable the development of targeted decarbonisation strategies.
We’ve built a new system to analyse UK heat networks4. By reclassifying the data, this research aims to spot key patterns within the sector through a process called cluster analysis. This helps pinpoint important traits across different types of heat network, making it easier to come up with carbon-reduction strategies.
We gathered data from various sources, to ensure a comprehensive analysis. This was then cleaned by removing duplicates, fixing errors, and making sure everything matched up with previous classifications of these networks. We considered nearly 960 networks, examining aspects such as location, type of network, customers, technology, and capacity.
We divided networks into two categories: communal and district. The former, which might include universities or hospitals, are further split, based on whether they serve a single site or multiple buildings under one ownership. District networks usually cover larger, city-wide areas.
We also categorised networks by their size – micro, small, medium or large – using normal probability analysis.
After organising the data, we applied two clustering techniques—manual sorting and k-mode clustering with Python3, that aids identification of heat networks that share similar attributes. Comparing the results from both methods helped us pinpoint the most representative groupings of the UK’s heat network market.
Data analysis and insights
Here’s what the data told us about the UK’s heat networks:
- Geographical distribution: Most heat networks are in urban areas, especially London and the North West. Rural areas, such as Wales and Northern Ireland, have fewer networks, showing potential for growth.
- Technology distribution: Smaller communal networks typically use combined heat and power (CHP) or heat pumps. Larger district networks opt for a mix of technologies, including energy from waste incineration
- Capacity variations: In urban settings, large-scale gas-fired CHP setups are common, whereas rural areas with less demand tend to go for bio-energy solutions.
The diversity in technology and capacity across the UK’s heat networks shows the complexity of different operational models. Communal networks, usually under a single owner, are easier to manage in residential buildings or institutions, but face challenges in commercial settings because of changing rental situations. District networks involve many different stakeholders, which adds layers of complexity to planning, legal matters, and financial commitments. This means we need a flexible approach.
Our use of manual and k-mode clustering techniques helped us identify distinct groups within the market. From here, we developed four main archetypes, each reflecting unique characteristics and energy needs.
Heat network archetypes
- Archetype A: Mainly rural networks, decentralised, using bio-energy and CHP systems
- Archetype B1: Small-scale, urban/suburban non-domestic systems that use gas-fired CHP and heat pumps, adapting to changes in occupancy
- Archetype B2: Larger, consistently demanded networks, in urban/suburban settings, such as hospitals and hotels, using gas-fired CHP
- Archetype C: Primarily domestic urban networks that might include mixed-use areas, flexible in scale, using gas-fired CHP and heat pumps
- Archetype D: Large-scale, urban district systems with mixed uses, employing a diverse range of technologies
By splitting the market into specific categories, everyone involved – from firms to government bodies – can come up with custom solutions that tackle particular challenges and seize the opportunities unique to each type of network. This focused approach means we can target technological improvements more accurately, which boosts energy efficiency and cuts carbon emissions.
This study presents an innovative approach to decarbonising the UK’s heat networks, emphasising the importance of customised strategies for leveraging low-carbon technologies.
About the author
Aya H Heggy doctoral researcher at the school of engineering, London South Bank University, Heggya2@lsbu.ac.uk
This article is based on the paper ‘Bridging the gap: from disparate data to decarbonisation strategies in UK heat networks’, which won the Most Effective Delivery of Material award at the 2024 CIBSE Technical Symposium.
References:
- Combined Heat and Power – Technologies,’ DESNZ, 2021.
- Heat networks registered under the Heat Network (Metering and Billing) Regulations statistics: December 2022, DESNZ, 2023. bit.ly/CJHnSt22
- A H Heggy et al, ‘District heat networks: Addressing categorisation to unlock deployment potential’, CIBSE Technical Symposium, 2023.
- L Bai and J Liang, ‘The k-modes type clustering plus between-cluster information for categorical data’, Neurocomputing, vol. 133, pp. 111-121, 2014, bit.ly/CJKMner
